Image:Exponential Function (Abs Imag Part at Infinity) Density.png
Un article de Wikipédia, l'encyclopédie libre.
Taille de cet aperçu : 728 × 600 pixels
Image en plus haute résolution (850 × 700 pixels, taille du fichier : 130 Kio, type MIME : image/png)
| | Ce fichier provient de Wikimedia Commons?. Les informations le concernant sont affichées ci-dessous (procédure). |
| Description |
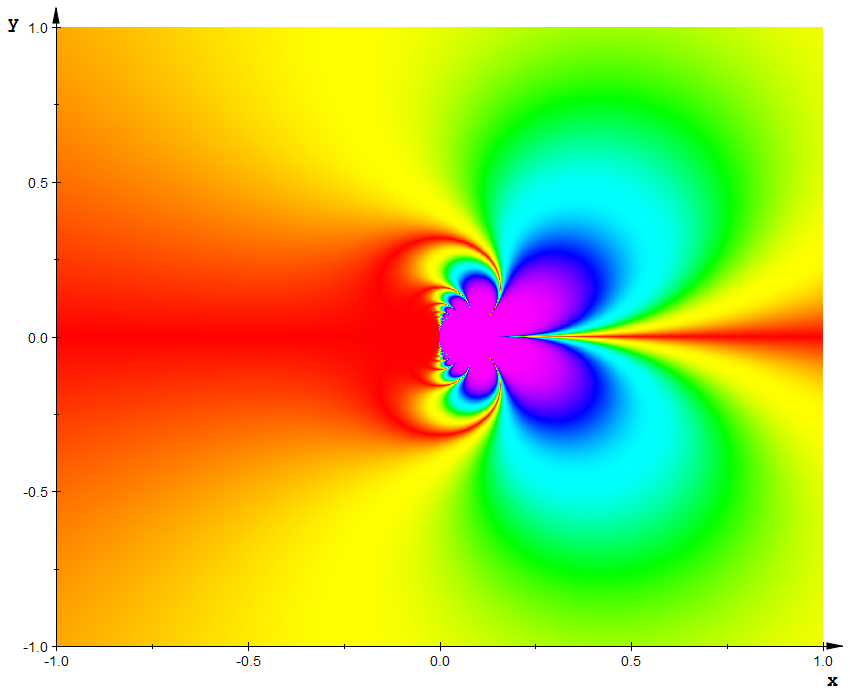
Diagram of the absolute value of the real part of the exponential function in the complex plane, as the operand approaches infinity. The plot is given by: The colour code is based on the arctan function and therefore emphasises changes at small values more than changes at large values. Green is smallest, then blue, red and yellow (largest). |
||
|---|---|---|---|
| Source |
Own drawing, Plotted in MuPAD, code given below. |
||
| Date |
20/04/2007 |
||
| Author | |||
| Permission (Reusing this image) |
|
||
| Other versions | See Exponential function for related graphics. |

[edit] MuPAD Code
 f := abs(Im(exp(1/(x+I*y)))):

  ylimit := 1:
  xlimit := 1:
  mesh := 1000:     //resolution of density plot

a    := 1:   //change this to adjust the colour band drop-of rate
fmin := 0:  //minimum value of colour function (i.e the one with arctan in it)
fmax := 1:  //maximum value of colour function
range:= 1:  //for brevity

colour := proc(c)
 begin
    if   c <  fmin then
       return ([1, 0, 0])  //this term may not be needed, but it means we can deal with slightly under-limit values
    elif c <= fmin + 1*range/6  then
       return ([1, abs(sin((c-fmin)*(PI/2)/(range/6))^a), 0])
    elif c <= fmin + 2*range/6 then
       return ([abs(sin((c-fmin)*(PI/2)/(range/6))^a), 1, 0])
    elif c <= fmin + 3*range/6 then
       return ([0, 1, abs(-sin((c-fmin)*(PI/2)/(range/6))^a)])
    elif c <= fmin + 4*range/6 then
       return ([0, abs(-sin((c-fmin)*(PI/2)/(range/6))^a), 1])
    elif c <= fmin + 5*range/6 then
       return ([abs(sin((c-fmin)*(PI/2)/(range/6))^a), 0, 1])
    elif c <= fmin + 6*range/6 then
       return ([1, 0, abs(sin((c-fmin)*(PI/2)/(range/6))^a)])
    else
       return ([1, 0,1])
  end_if
end_proc:

  colfunc := (x,y,z) -> colour(arctan(z/2)*(5.0001/6)/(0.5*PI)): //the factor of 5/6 prevents the spectrum from wrapping
                                                                // by precisely one colour transition (m->r).
                                                                //The extra 0.00001 is to prevent an error when evaluating the 5th elif clause.
                                                                //No idea why, but it must be sometihng to do with there being a 5/6 in there.


  cplot := plot::Density(f,
                         x = -xlimit..xlimit,
                         y = -ylimit..ylimit,
                         AntiAliased = TRUE,
                         Mesh = [mesh, mesh],
                         AxesTitleFont = ["Courier New", Bold, 14],
                         TicksLabelFont = ["Arial", 10],
                         FillColorFunction = colfunc,
                         YTicksDistance = 0.5,
                         XTicksDistance = 0.5):

  time((plot(cplot,
             Axes = Frame,
             Width = 8.5*unit::inch,
             Height = 7*unit::inch)))*sec/1000.0
Historique du fichier
Cliquer sur une date et une heure pour voir le fichier tel qu’il était à ce moment-là
| Date et heure | Dimensions | Utilisateur | Commentaire | |
|---|---|---|---|---|
| actuel | 25 avril 2007 à 20:25 | 850×700 (130 Kio) | Inductiveload | ({{Information |Description=Diagram of the absolute value of the real part of the exponential function in the complex plane, as the operand approaches infinity. The plot is given by: ::<math>z=\bigg|\operatorname{Im} \left (\exp \left( \frac{1}{x + i y} \r) |
| 25 avril 2007 à 20:19 | 850×700 (130 Kio) | Inductiveload | (Reverted to earlier revision) | |
| 25 avril 2007 à 20:11 | 850×700 (130 Kio) | Inductiveload | (Reverted to earlier revision) | |
| 25 avril 2007 à 20:09 | 850×700 (130 Kio) | Inductiveload | (New smoother colour scheme) | |
| 25 avril 2007 à 20:08 | 850×700 (130 Kio) | Inductiveload | (New smoother colour scheme. ) | |
| 22 avril 2007 à 04:06 | 850×700 (139 Kio) | Inductiveload | ({{Information |Description=Diagram of the absolute value real part of exponetial function in the complex plane, as the operand approaches infinity. The plot is given by: ::<math>z=\bigg|\operatorname{Im} \left (\exp \left( \frac{1}{x + i y} \right)\right)) |
Pages contenant l’image
La page ci-dessous contient cette image :


_Density.png)
_Density.png)
_Density.png)
_Density.png)
_Density.png)