Image:Diag phase glace.png
Un article de Wikipédia, l'encyclopédie libre.
Pas de plus haute résolution disponible.
Diag_phase_glace.png (337 × 347 pixels, taille du fichier : 2 Kio, type MIME : image/png)
| | Ce fichier provient de Wikimedia Commons?. Les informations le concernant sont affichées ci-dessous (procédure). |
 |
This graph image should be recreated using vector graphics as an SVG file. This has several advantages; see Commons:Media for cleanup for more information. If an SVG form of this image is already available, please upload it. After uploading an SVG, replace this template with template {{Vector version available|new image name.svg}} in this image. |
|
العربية | Български | Català | Česky | Dansk | Deutsch | English | Esperanto | Español | Français | 한국어 | Italiano | Magyar | Lietuvių | Nederlands | 日本語 | Polski | Português | Română | Русский | Suomi | Svenska | Türkçe | Українська | Tiếng Việt | मराठी | 中文(繁體) | 中文(简体) | +/- |
|
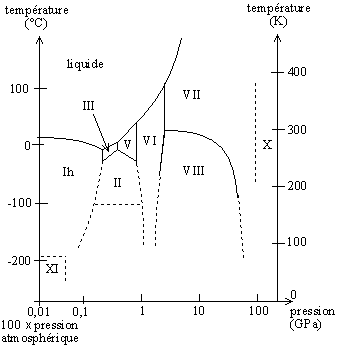
Diagramme de phase de la glace en fonction de la pression et de la température ; l'échelle des pressions est logarithmique.
- Avertissement : le diagramme de phase est repris d'une illustration largement utilisée (par exemple ici), mais qui est elle-même erronée : on remarque que seule une graduation en degrés celsius est présente, et qu'elle est mal placée. Il faut donc prendre ce diagramme à titre indicatif
On peut voir d'autres formes de ce diagrammeici, là, là, encore ici ou là, là et là.
Ice phase diagram along the temperature and pressure changes; the scale of pressure is logarithmic.
- Warning: the phase diagram is inspired by a widely used illustration (e.g. ici), but which is erroneous: only one tick is present for °C, and it does not correspond to the kelvin scale. This diagram is thus to be considered only as tendencies.
Other diagrams can be seen here :[1] [2] [3] [4] [5] [6] [7].
Auteur/author : Christophe Dang Ngoc Chan

Historique du fichier
Cliquer sur une date et une heure pour voir le fichier tel qu’il était à ce moment-là
| Date et heure | Dimensions | Utilisateur | Commentaire | |
|---|---|---|---|---|
| actuel | 7 août 2005 à 23:29 | 337×347 (2 Kio) | Tornad | (optim poids de l'image) |
| 21 mars 2005 à 17:43 | 337×347 (3 Kio) | Cdang | (diagramme de phase de la glace - Ice phase diagram) |
Pages contenant l’image
Les pages ci-dessous contiennent cette image :

